How big data works?

How do we use it at FunCorp, and why it’s one of our most important tools
Going by the most recent reports, the number of users for smartphones will hit a whopping 3.8 billion by the year 2021. This sweeping increase in smartphone users has also led to a rising demand for better mobile apps. These modern apps also use tremendous amounts of data, and thus, a robust management tool for analyzing and managing this data has become a necessity. And this is where the use of Big Data technology for building apps comes into the picture.
At FunCorp, we use big data as a driver for company development. Almost all departments of the company use analytics to make decisions:
- The Product team uses the data to analyze and predict user behavior and develop hypotheses for A/B tests and further analysis.
- The Machine Learning team uses the data to generate recommendations.
- The Engineering team uses the data on the stability of the primary services, on the state of our leading platforms for iOS, Android, and the online platform.
- For User Acquisition, we collect all the preliminary data for building CPI, CPC, CPM, LTV, ARPU metrics, and, based on analytics, create predictions of advertising campaign performance.
- Within the Monetization team, we use data for A/B testing for advertising formats and their placement and monitor the work of our advertising partners.
System Description
Some statistics of our system:
- 11,000,000,000 events per day or ~ 700 GB of data
- 1,500,000 events per minute during peak hours
The database receives ~500 different events with hundreds of parameters that display:
- UI user activity
- All possible user interactions with content: starting with the classic "like," "dislike," "share," "save" till the time when the user makes a pause on the content and uses UI actions with the content, such as zooming (zoom)
- Network activity: latency, error, etc.
- Performance and errors in iOS / Android applications: Memory, Battery, Crashes, ANR
Also, we import data from internal databases and external systems:
- All information from internal databases that is not personalized or confidential
- Appsflyer to collect information about the attribution of mobile installations
- Data from Google Adwords, Facebook Ads, Snapchat Ads, and others to control advertising campaigns
- AppFollow, Helpscout for analysis, and work with user's feedback
Systems for data visualization that we use:
- Redash for product metrics, ad-hoc requests, and use by external clients
- Grafana to display technical metrics
- Google Spreadsheets for external partners and, as an alternative, to other systems
What tasks does the system have?
- Ability to receive large amounts of data
- Self-recovery. Ability to self-recover the system in case of a failure
- Ability to visualize data for end-users
- Database operation speed. It is necessary to process a large amount of information in a short period
- Ability to work with the recent data (real-time analytics)
Data Pipeline
For many data-driven companies, a data pipeline stitches together the end-to-end operation consisting of collecting the data, transforming it into insights, training a model, delivering insights, applying the model whenever and wherever the action needs to be taken to achieve the business goal.
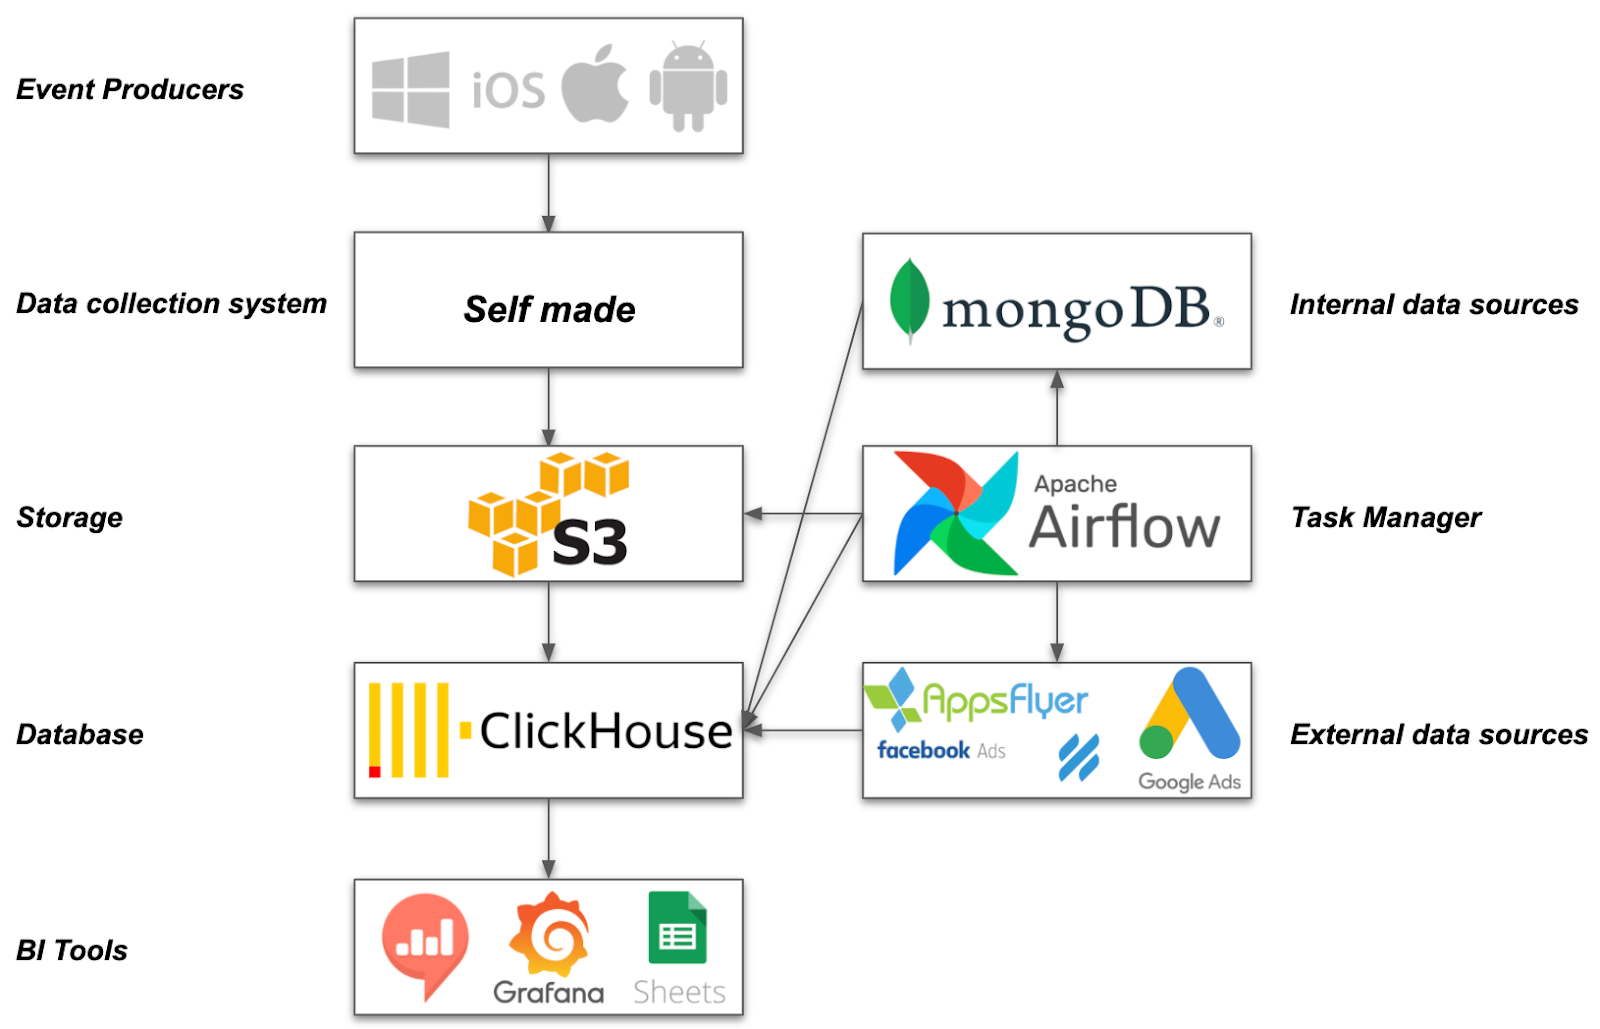
Event Producers
The main event generators are the mobile products of Funcorp: Android and iOS applications and websites.
Data collection system
- The system's primary purpose is to collect clients events and then write them in the S3 storage. The system has a basic check of the events on validity
- Correspondence of JSON message to the format
- The time of event reception is within a time window of +-24 hours to the server time. Thus we cut off an insignificant amount of incoming data, which can slightly change the results of the following data aggregation
- The primary event syntax checks to avoid overloading with S3 "waste" events and other event import systems in ClickHouse
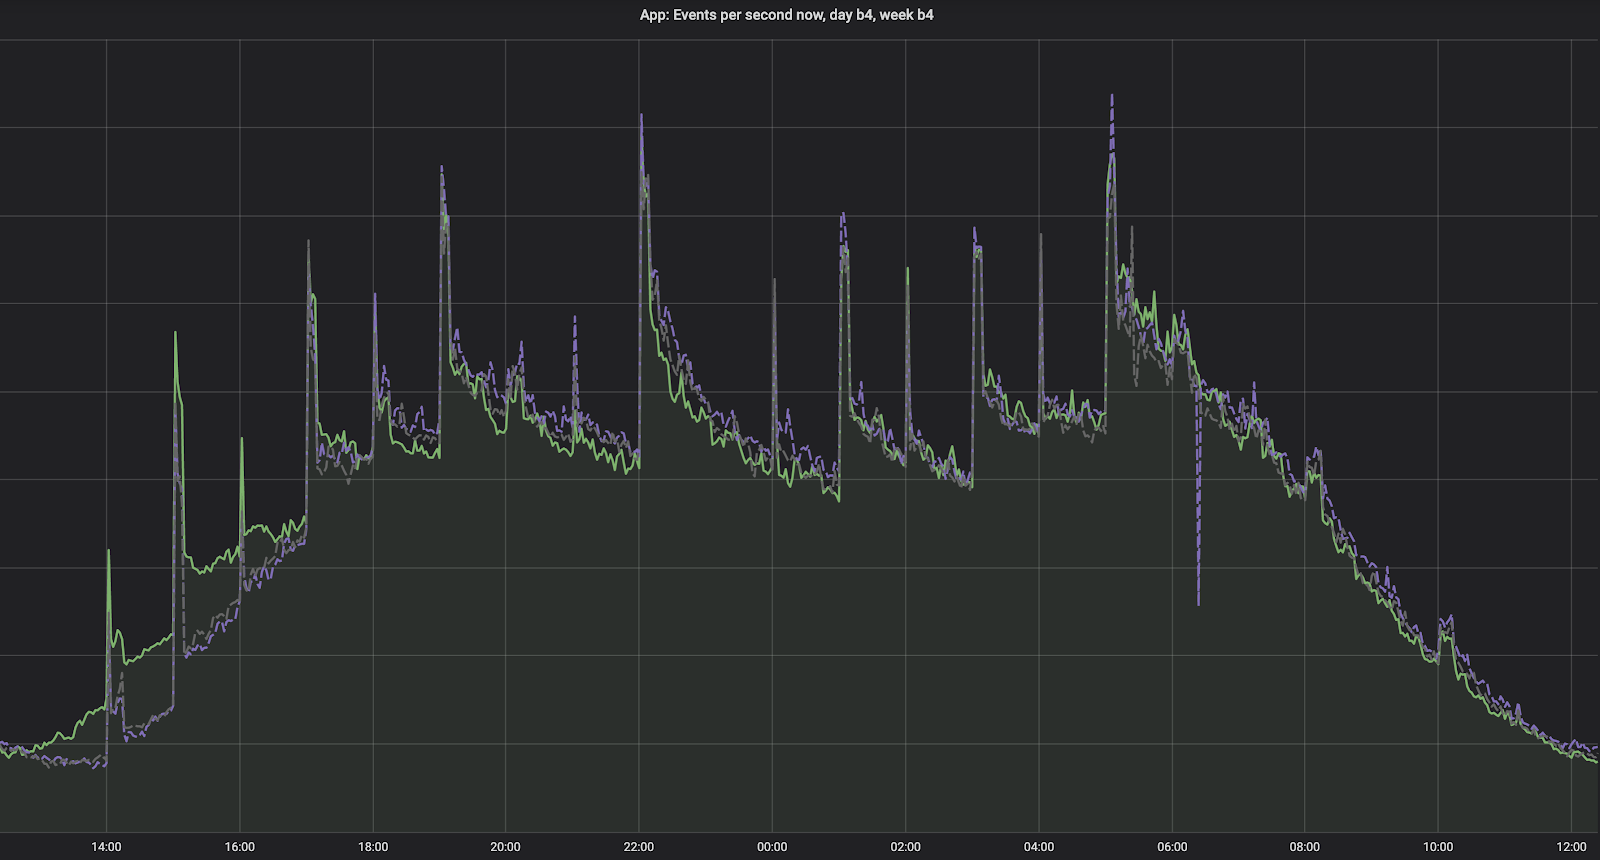
The main service metrics, which we regularly follow:
Number of events received and recorded on S3 per minute.
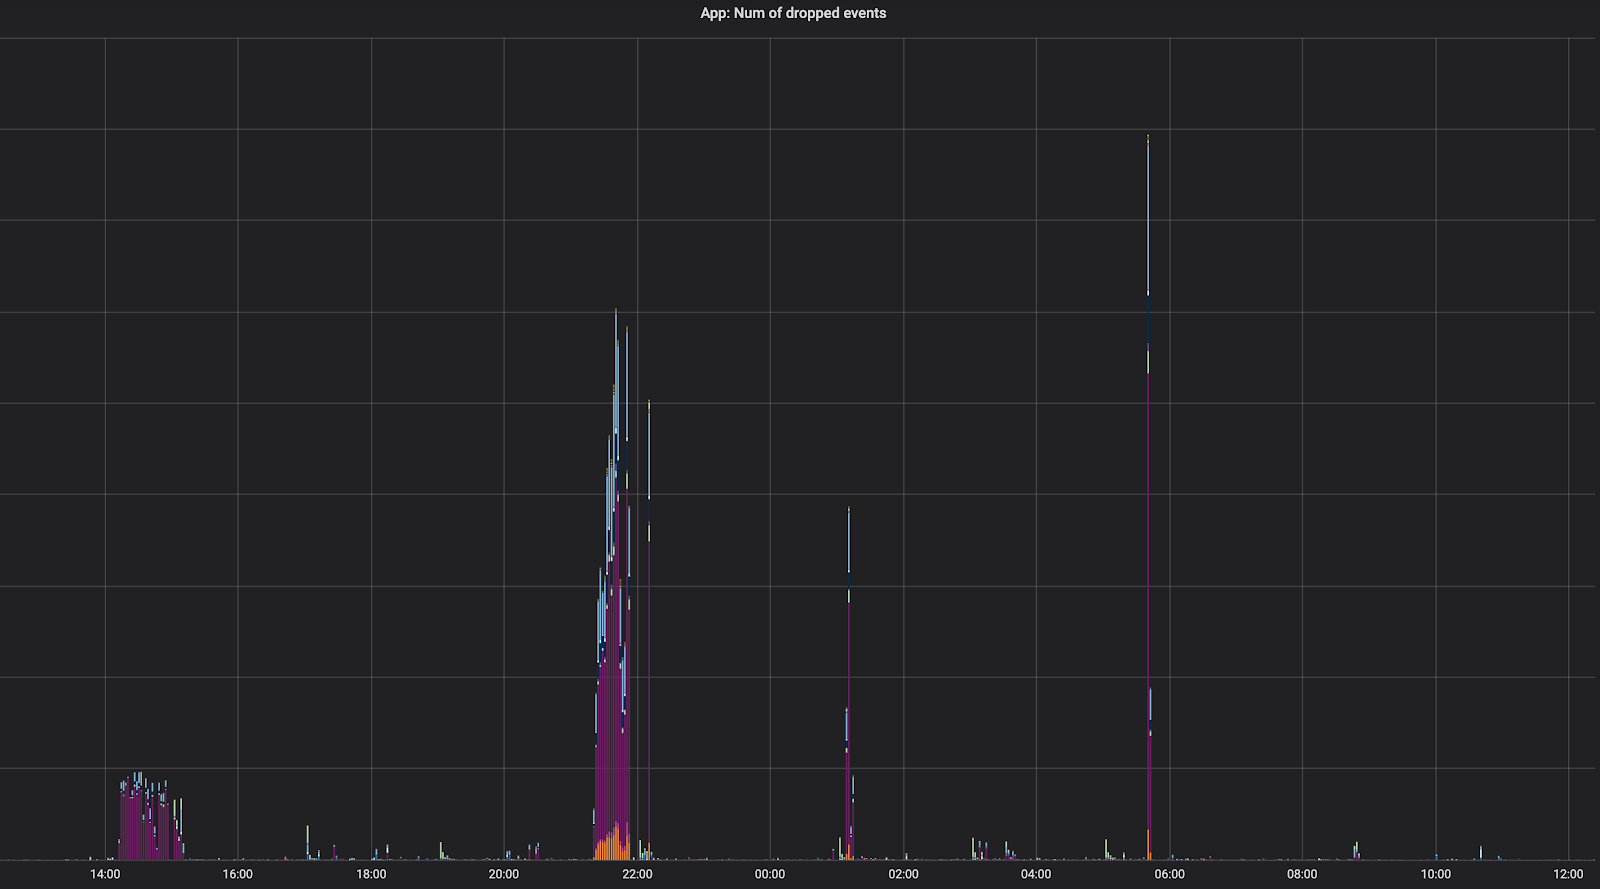
The number of events that have not been validated, which may indicate an error in the event delivery.
Storage
We store all the events in S3 storage, as well as ClickHouse dumps.
Database
ClickHouse is an open-source column-oriented database management system that allows generating analytical data reports in real-time.
For a long time, Funcrop used Redshift as a database for events that take place in backend services and mobile applications. It was chosen because there were no alternatives comparable in cost and convenience at the time of implementation.
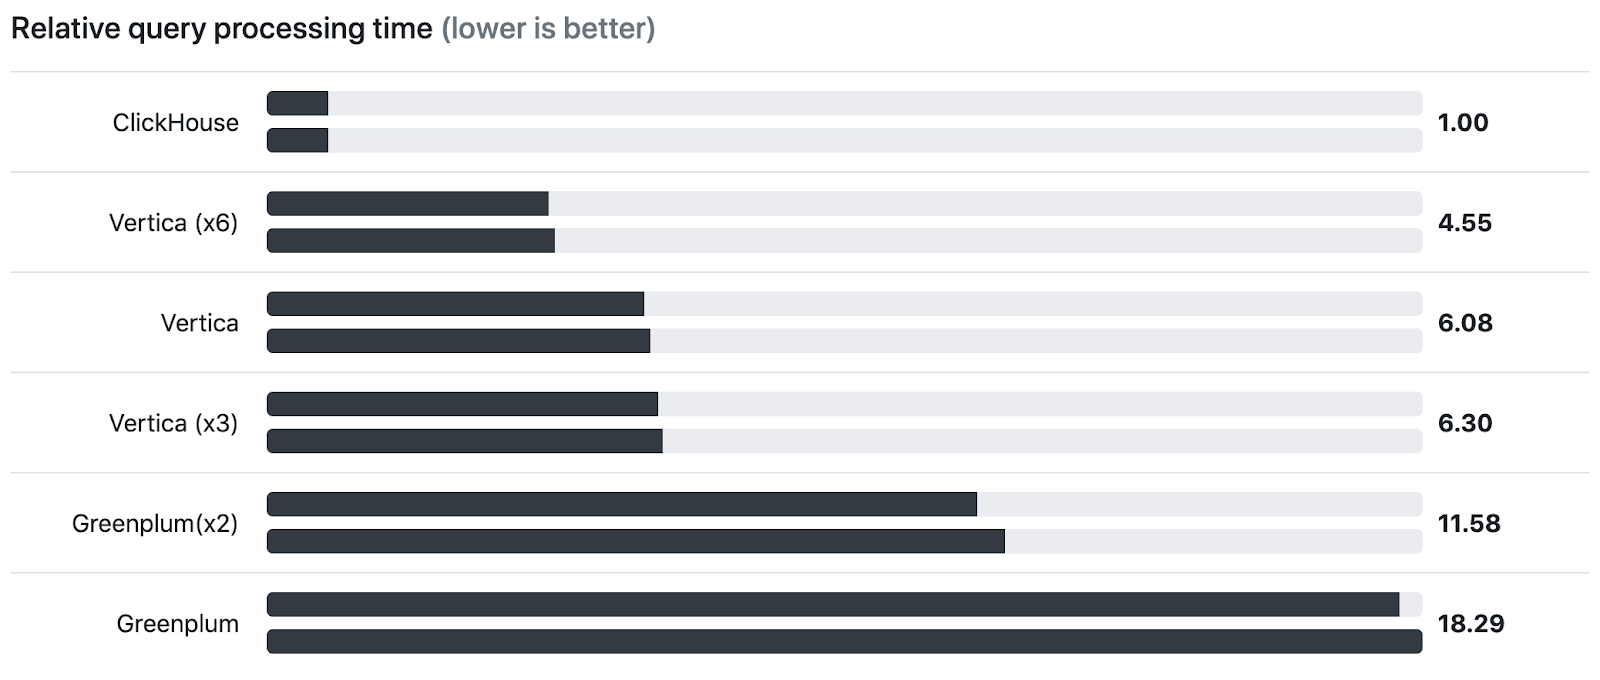
However, everything has changed after the public release of ClickHouse. We studied it for a long time, comparing the cost, estimating the approximate architecture, and decided to stop on Clickhouse as the central database for working with events.
In many comparative tests of database performance, Clickhouse takes the first place in the charts:
Data delivery from S3 to ClickHouse; you can't just make the loading with built-in ClickHouse tools, because the data on S3 is in JSON, each field needs to be taken by its JSON path, and sometimes you need to apply the transformation, we didn't find anything ready, so we had to make it. Briefly, this is an HTTP service that is deployed on each host with ClickHouse. You can address any of them. In the query parameters, you can specify the S3 prefix from which files are taken, the JSON path list for transformation from JSON to a set of columns, and many modifications for each column.
Task Manager / ETL
Apache Airflow (or simply Airflow) is a platform to programmatically author, schedule, and monitor workflows.
- Airflow has all the main tasks that run in the system
- Import of new events from S3 storage
- Creation of daily, weekly, and monthly event aggregations
- Calculation of business and product metrics for their further upload to BI systems
- Sending metrics to slack (both as information messages and as alerts)
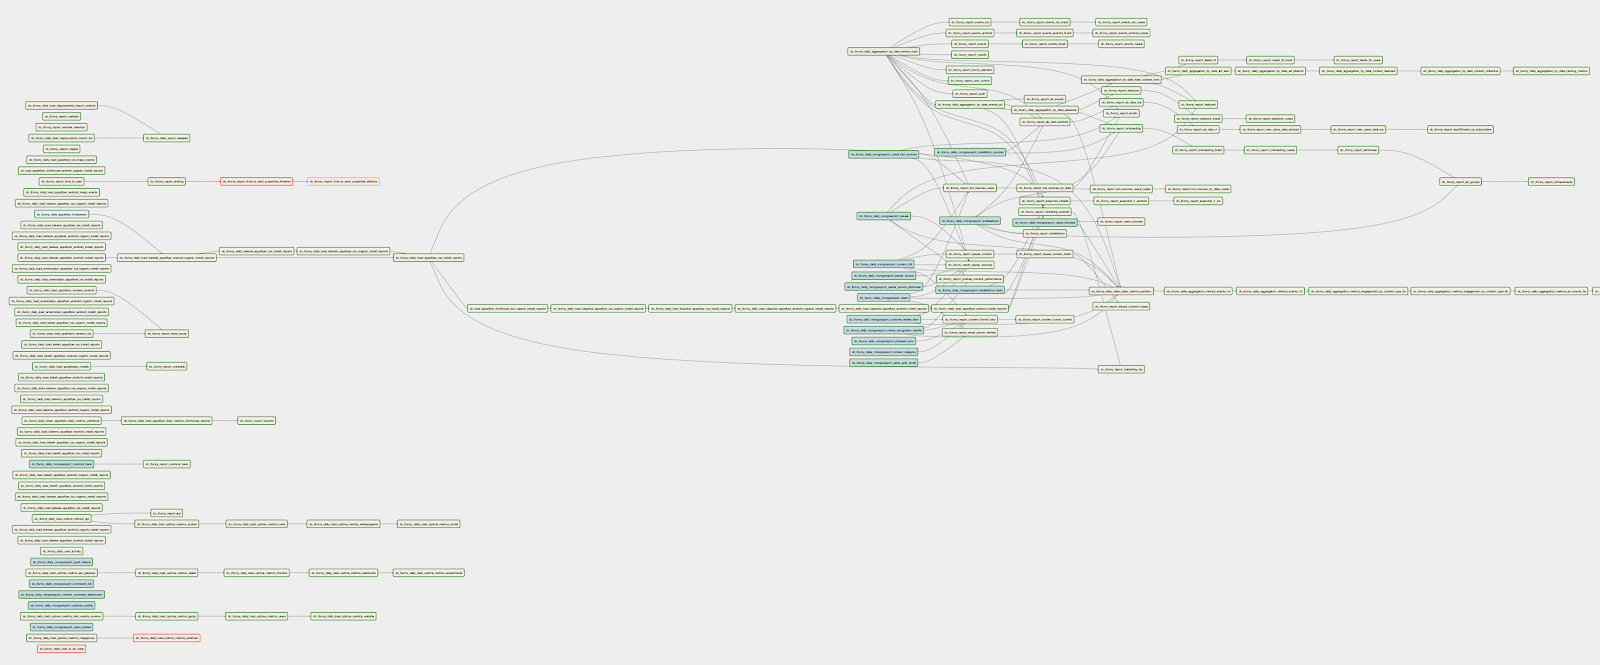
All tasks in Airflow are grouped in dags; in one dag, hundreds of functions are linked with each other by dependencies (when one job cannot be started before the other one has finished) or by the frequenåcy of their start.
Example of one of the dags where we calculate main metrics for the day:
BI Tools
At FunCorp, we use several systems to visualize data, each of which serves a specific purpose:
- Redash is used for product and business analytics; here, we see the real-time metrics of A/B tests and general application metrics on time charts
- Grafana is used for displaying technical metrics
- Google Spreadsheets is a convenient tool for providing data to third parties: advertising agencies and partners
Conclusion
This system allows us to process and obtain valuable information from terabytes of data, which ultimately affects the growth of product metrics, and this means the business metrics as well.


